11 March
11 March · 20:35 UTC
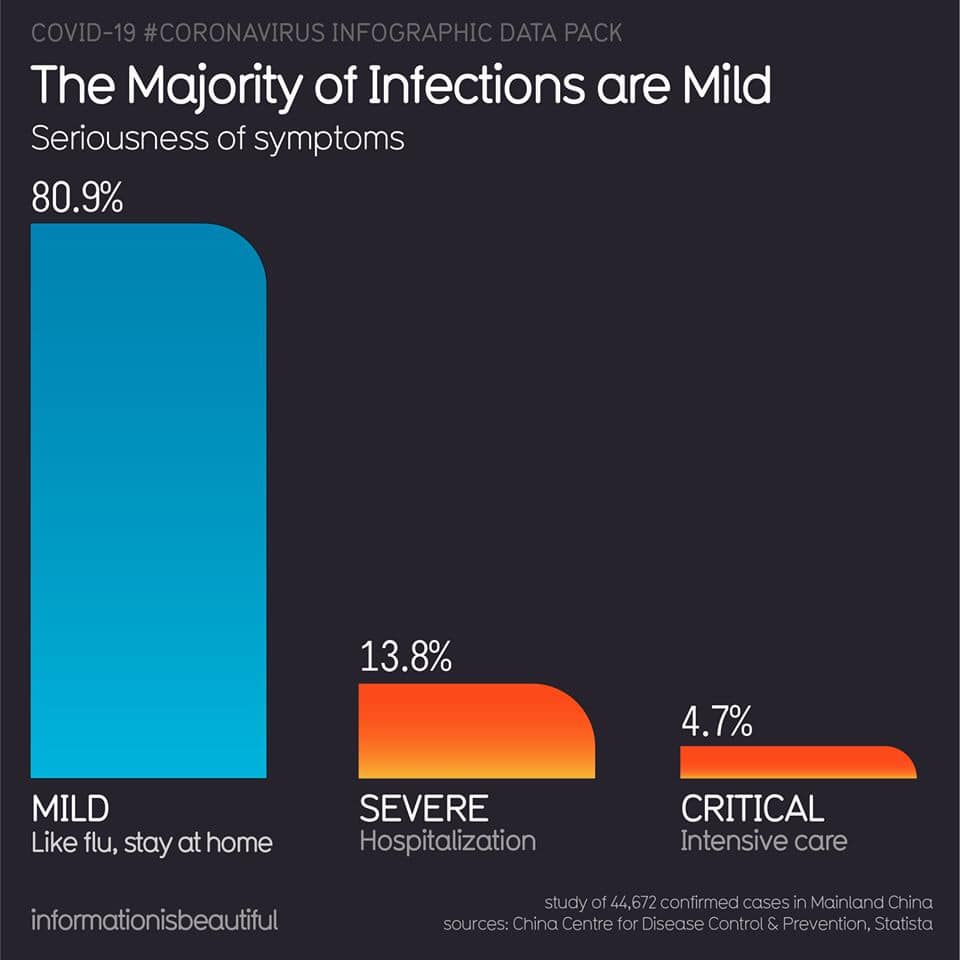
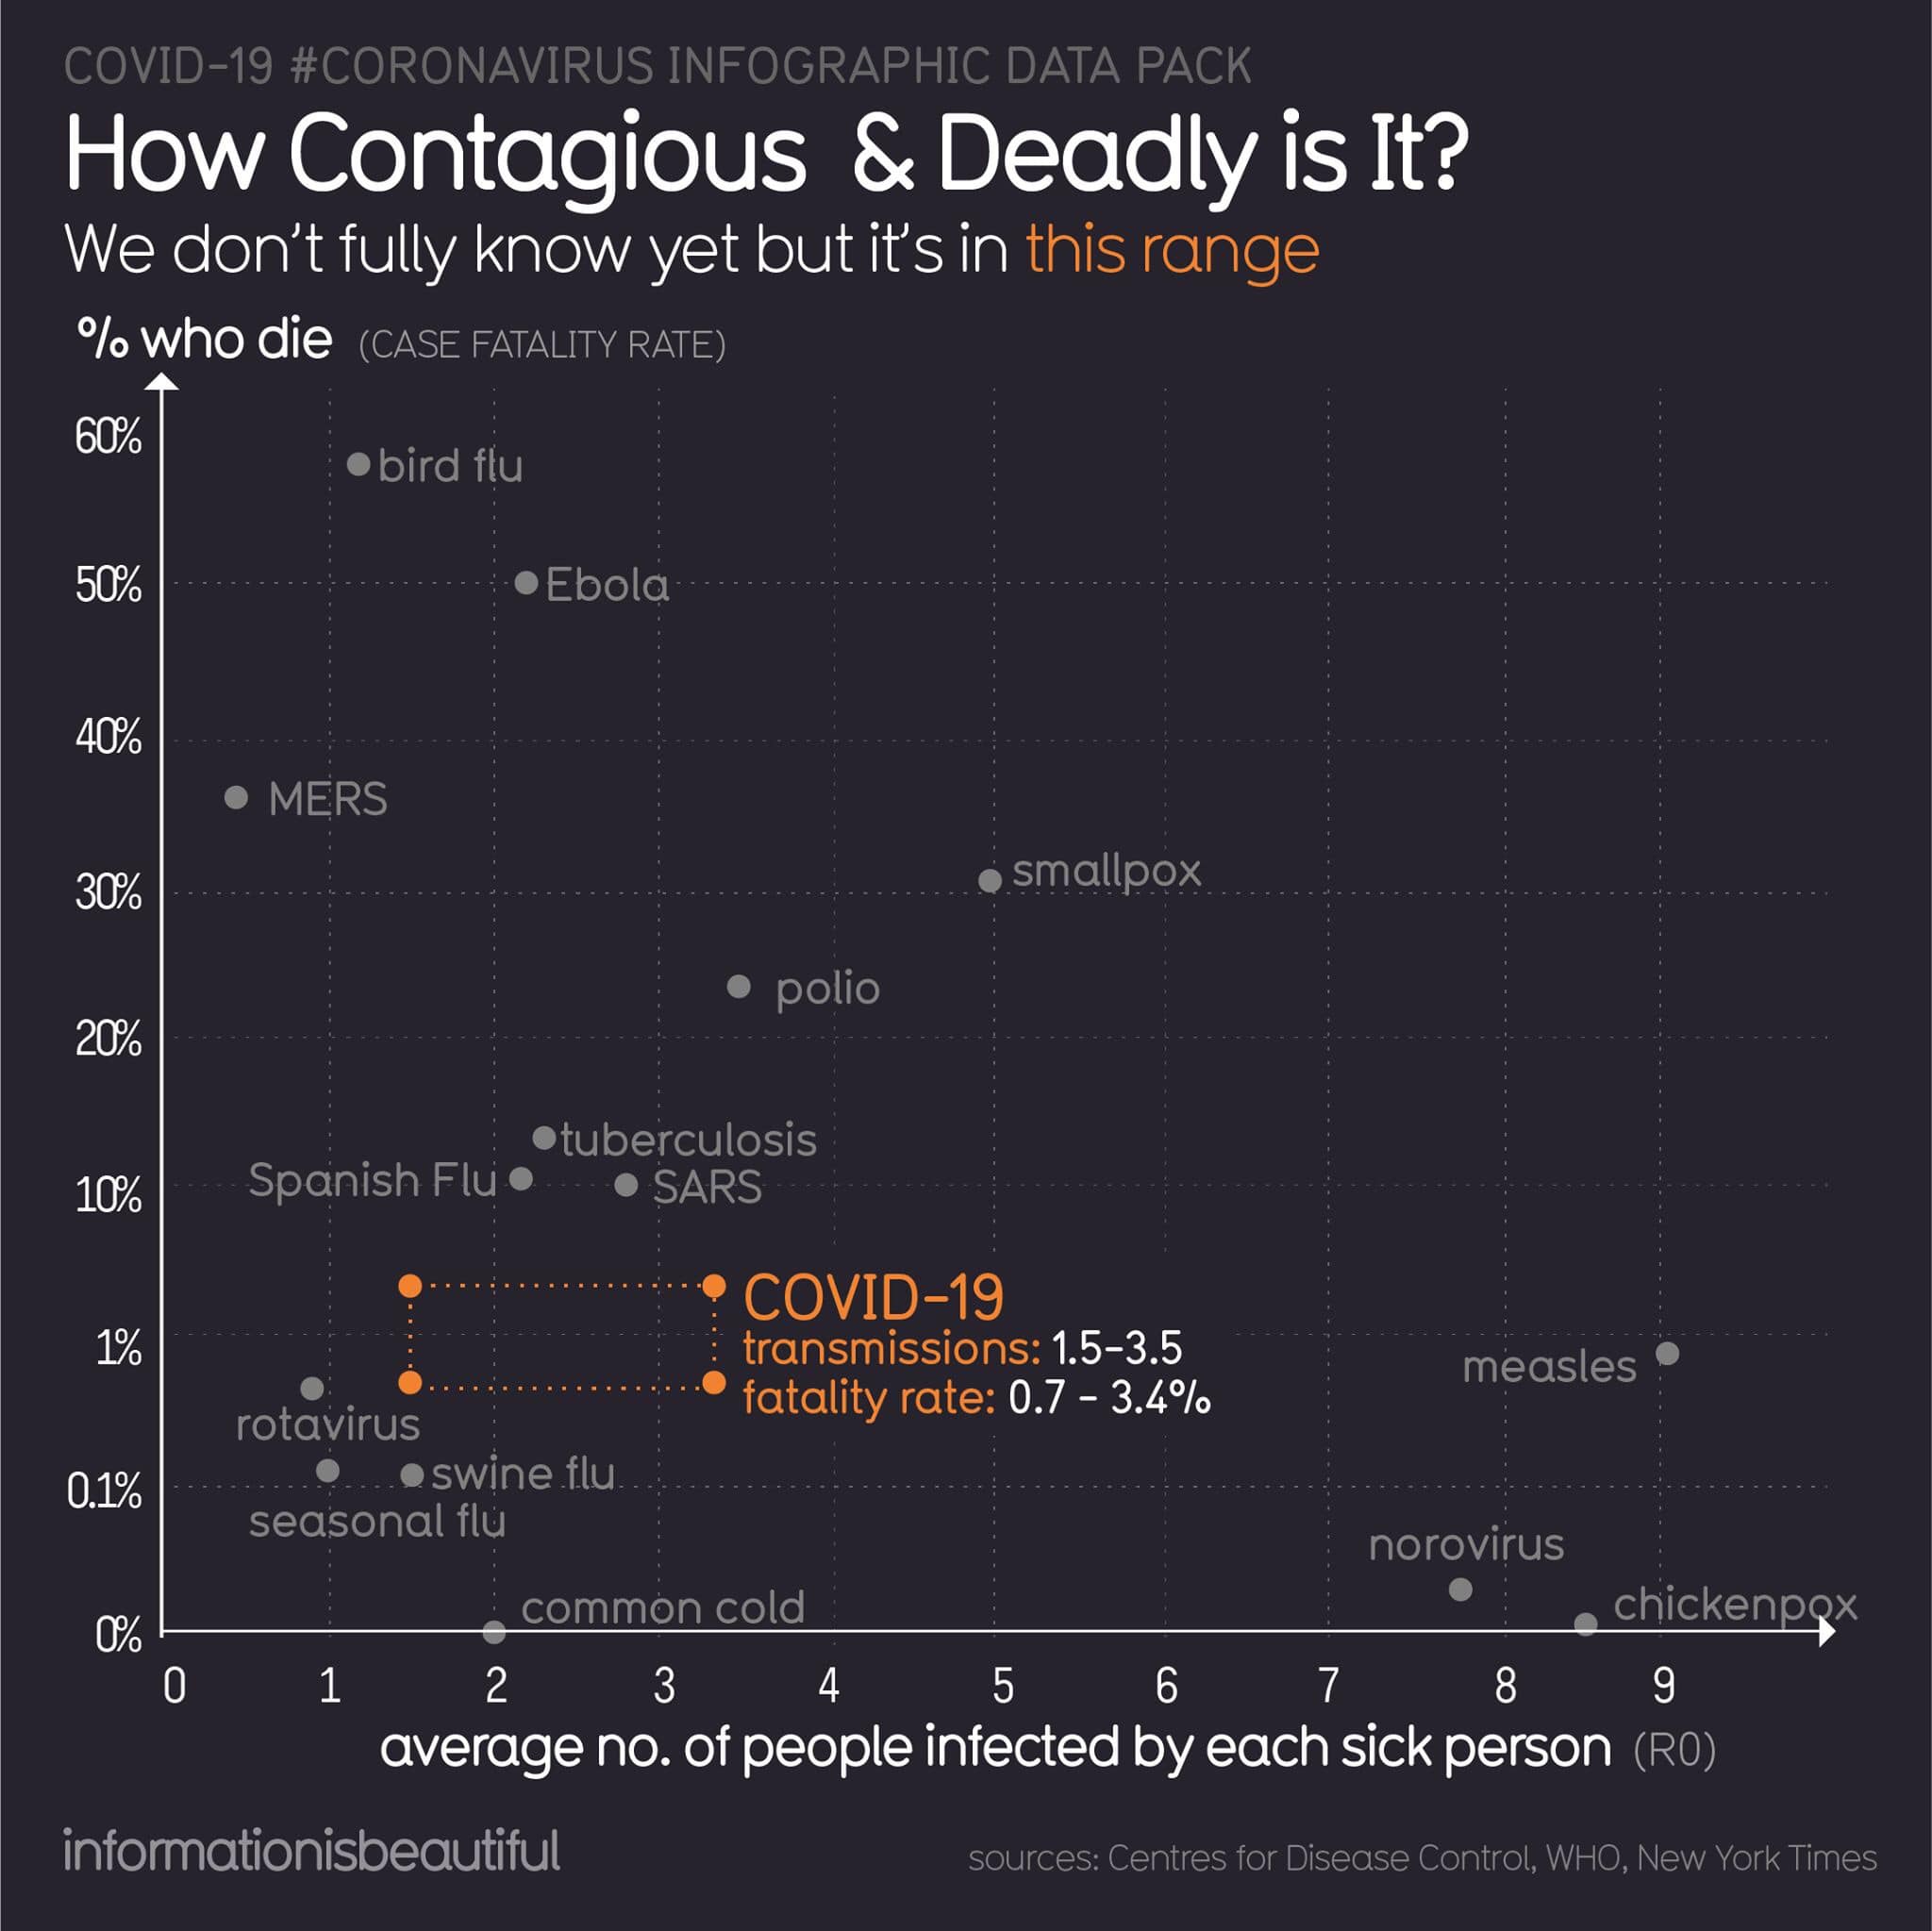
I think we should be cautious about these graphs and numbers circulating online. I have serious genius mathematician friends on FB, they’ll correct any of my thinking! Also sorry it’s hard to do this stuff in Twitter-sized sound bytes. Many relax when they see the numbers on that column graph, because they’re not in the high risk groups. That’s our populist mind at work, thinking only of the individual. The graph with all the illnesses on it is key though - while CV19 is lower on the fatality rate, the second anything gets past that infect more than one person line, it’s exponential growth. The real risk with pandemics is not the lethality of the virus itself (really lethal viruses don’t often cause pandemics). The risk is the scale or number of people infected, which quickly (exponentially) overwhelms our standard processes, like health care. The small percentages of people in those high risk categories become many *thousands* of people, all getting sick at once. That’s a disaster even for people in the low risk categories, because even though their PERCENTAGE chance of getting critically ill is low, the sheer number of people infected means hundreds or even thousands of people even in the low risk categories will become critically ill, and may not get care in a swamped health system.