10 March
10 March · 03:43 UTC
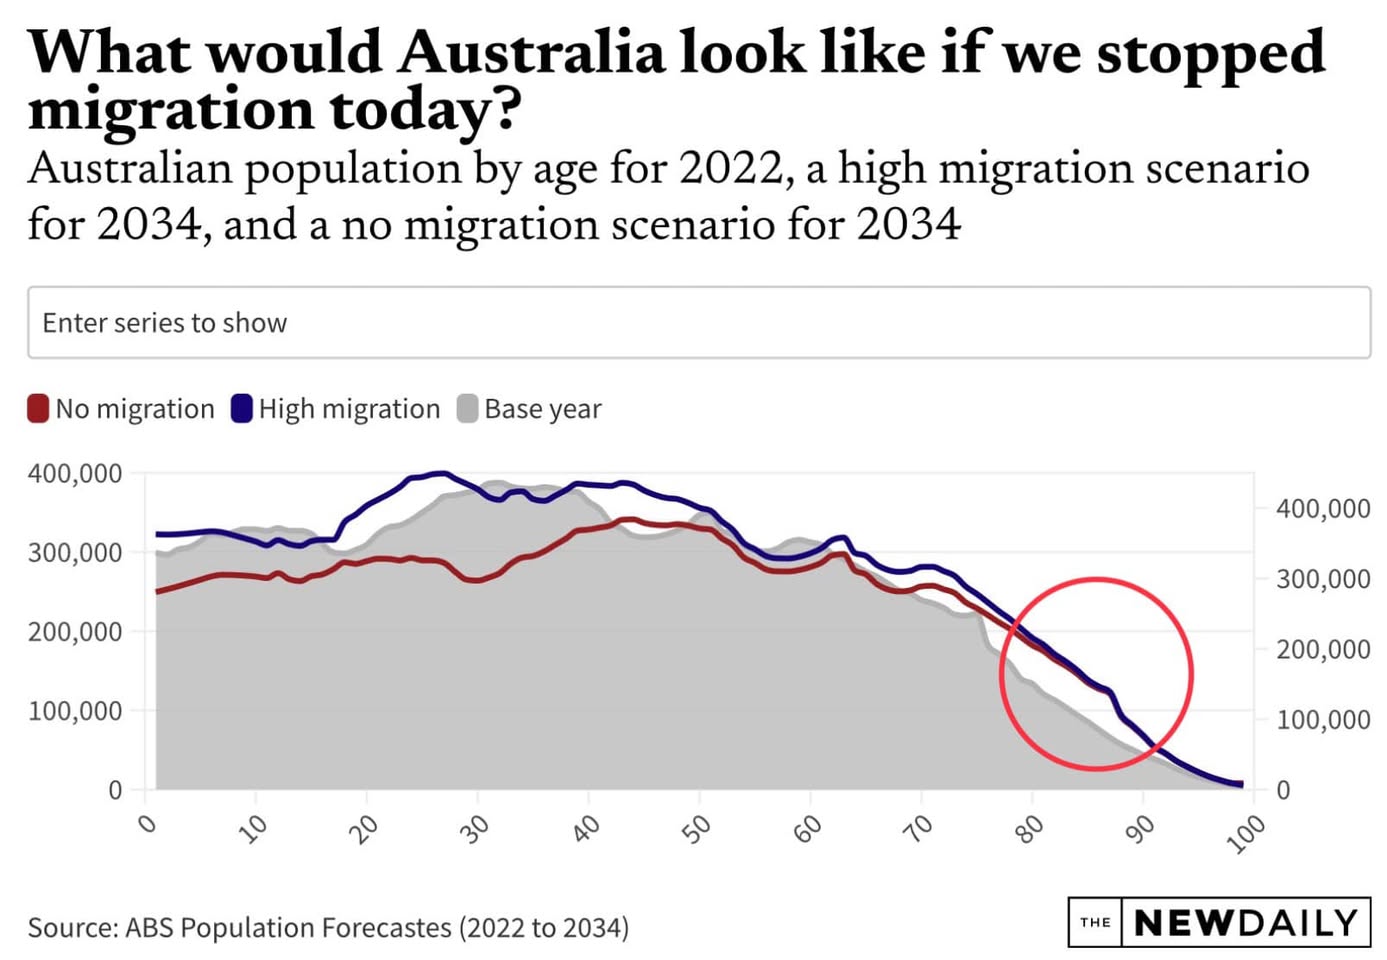
Fascinating graph that should make us question the Australia we think we know (and it applies to many Western countries). The grey is Australia’s population broken into age groups, in 2022. Blue is what 2034 will look like, if we have high migration. Red is no migration at all. The key thing here is how the blue and red lines are almost identical, past the age of 50. That’s because we’re an ageing society, and we import much of the workforce we need. The same applies to most Western countries. They’re all very old, and getting older. The only way they keep going is importing new young workers from overseas, to do the work. But then they kick them out again, they don’t want them living here and getting old. That’s why the blue and red lines converge completely past working age. Cutting migration won’t cut our population, because without the migration there’s nobody to do the work. The number of people who are 85 or older will double in the next decade. Without migration there’ll be nobody to look after our very old country. Young workers will be like gold globally, from places like India. As they get richer, they may have far fewer young workers to spare.