16 August
16 August · 00:05 UTC
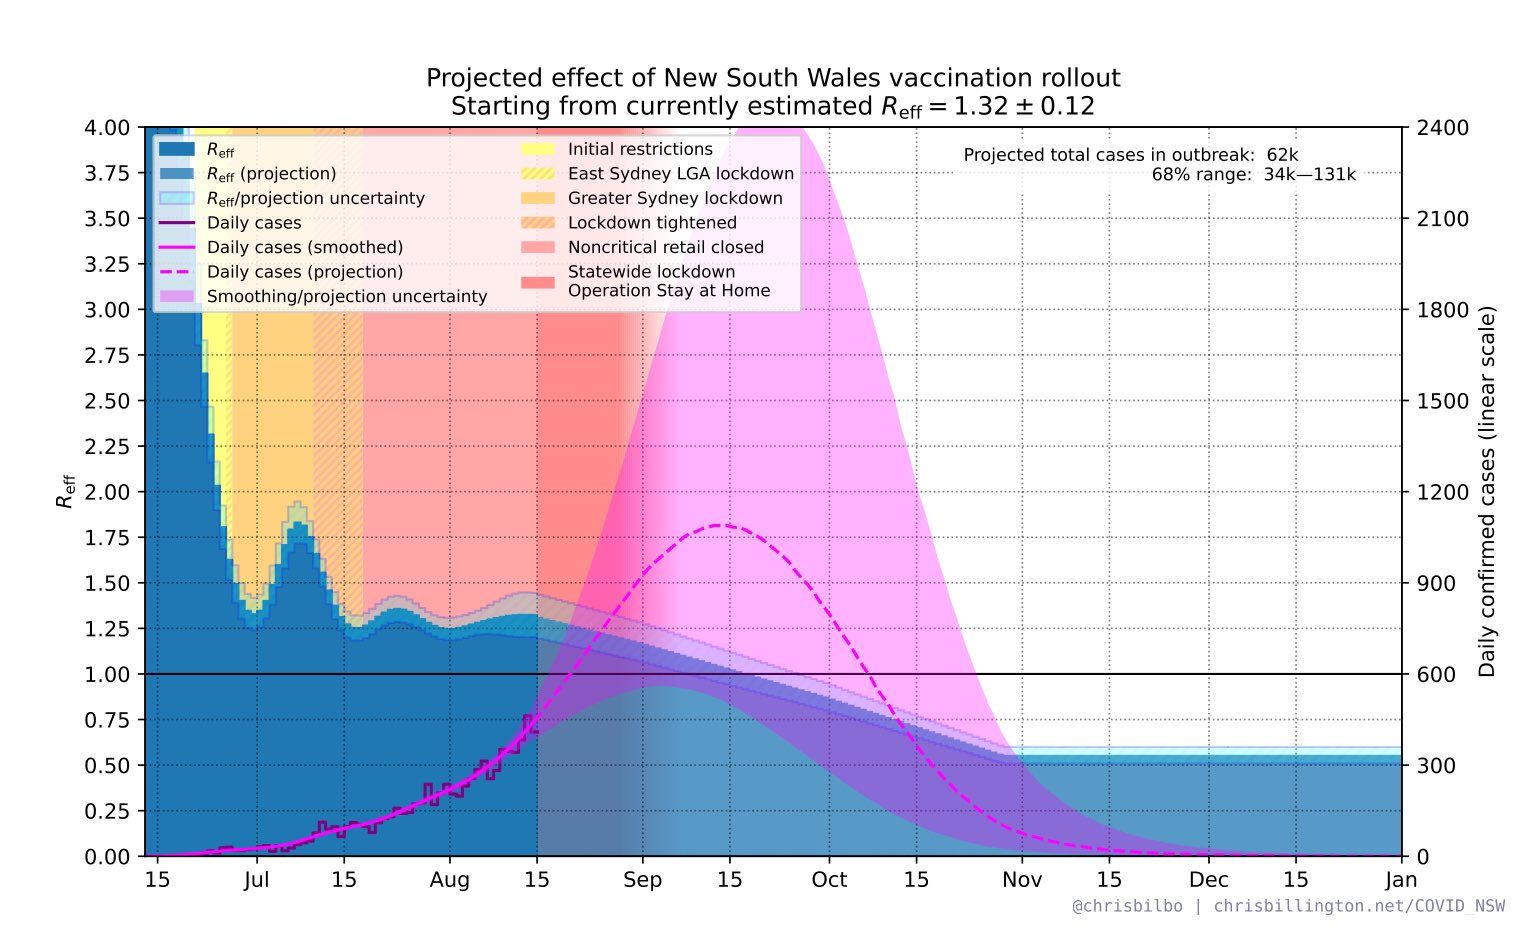
Very interesting graph showing projected impact of vaccination on the NSW outbreak. The different colour shadings are the different restrictions introduced over time. Note that the assumption here is heroic - that vaccination will cut transmission by 80%. (It won't, it'll be lucky to reach half of that.) But even with these heroic assumptions, that's 1200 cases per DAY, at the peak in mid-September.
Nick Dee added a new photo.
1 media reference recorded in the export