15 July
15 July · 22:22 UTC
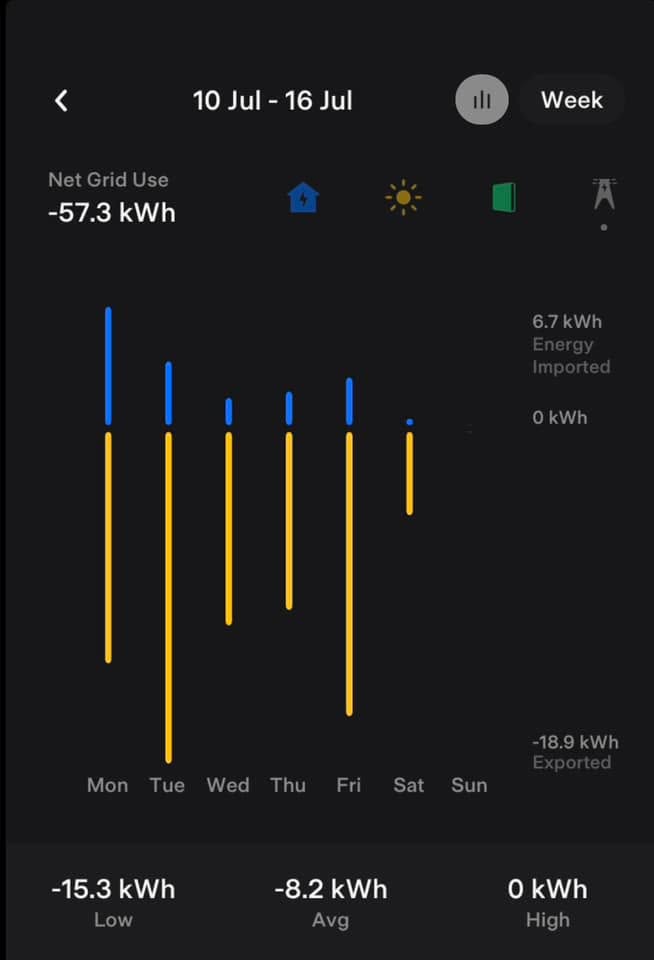
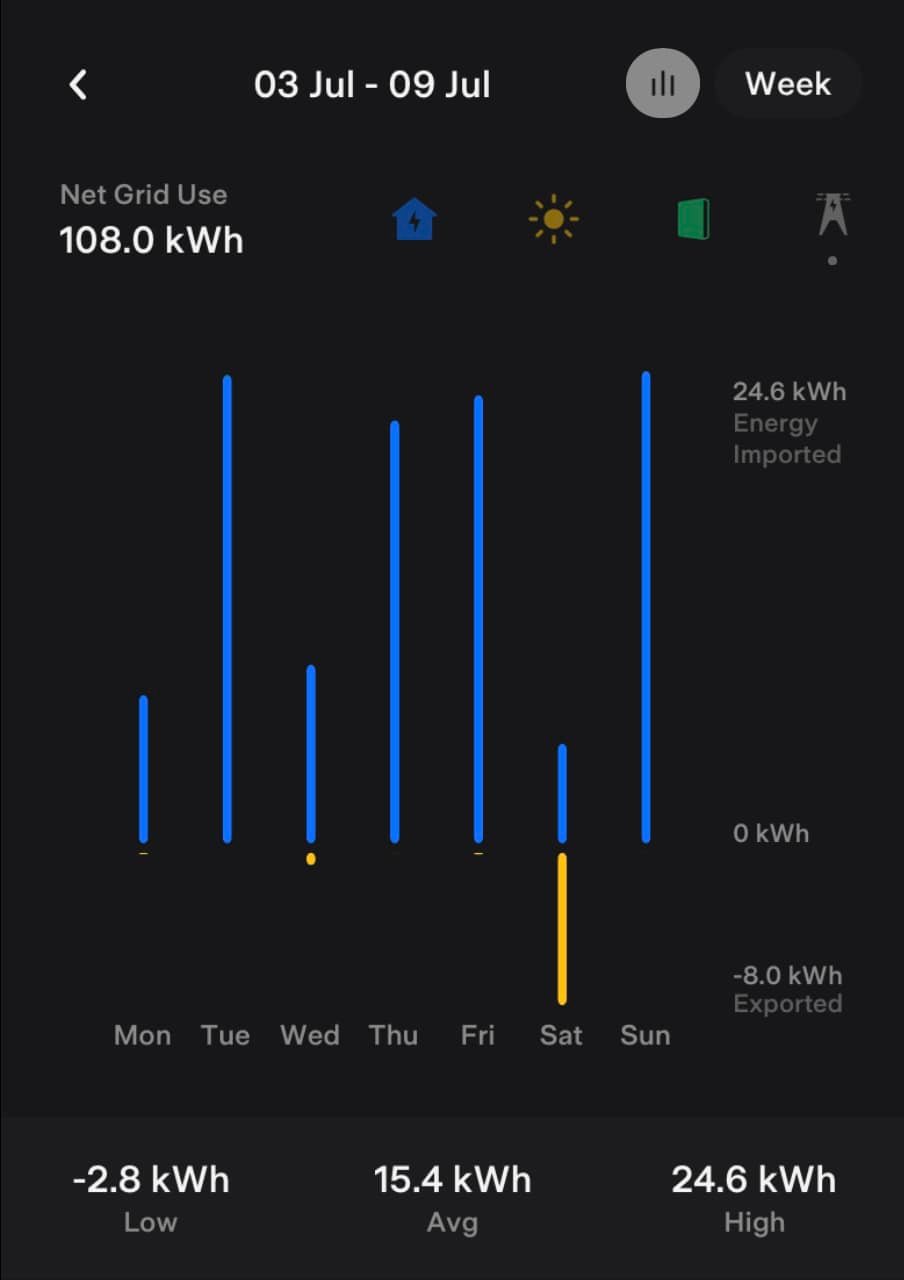
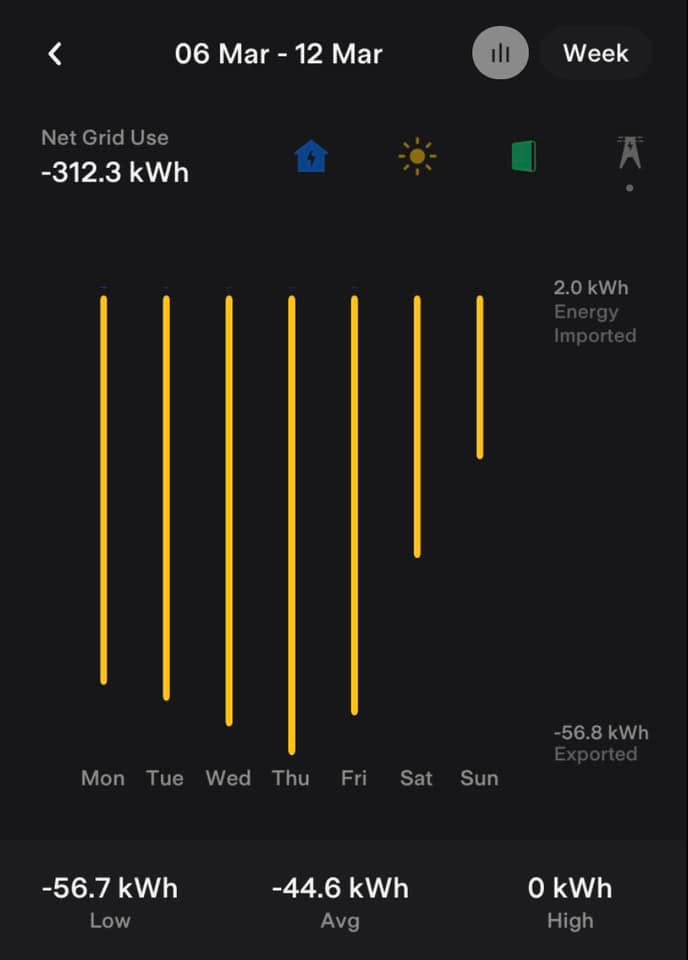
These three figures show weekly energy use in our house, in 3 different weeks. Blue means electricity imported from the grid, yellow electricity exported to the grid, by us. You can see the past 2 weeks have been fundamentally different. The first week of the holidays was very cloudy and dark, and we had to import electricity from the grid. Lots of blue. (Our use during the day is still mostly covered by solar, even on a cloudy day. The imported amounts are mostly evenings, because the battery didn’t get a chance to fully charge during the day. We were also all at home for holidays, mid-winter and heating, so usage was higher than normal.) This week the sun came out, and the yellow (exports) dominate. Then rewind back to March at the beginning of Autumn, and we were importing nothing at all, as we don’t pretty much for every season except winter. All yellow bars. This is the longer-term view that can get missed. The surplus in 3 seasons of the year easily covers any imported electricty in winter. Just as the cost of installing the system is only understood by considering what it costs you over 5-10 years, not when you first install it. It will pay for itself, often inside 3 years without a battery. With a battery a few years longer, but those prices are plummeting, and also you get protection from grid instability in the meantime, and that’s coming, in the next 5-10 years. If you have solar but not battery and there’s a blackout, you lose power like everybody else.