23 January
23 January · 19:11 UTC
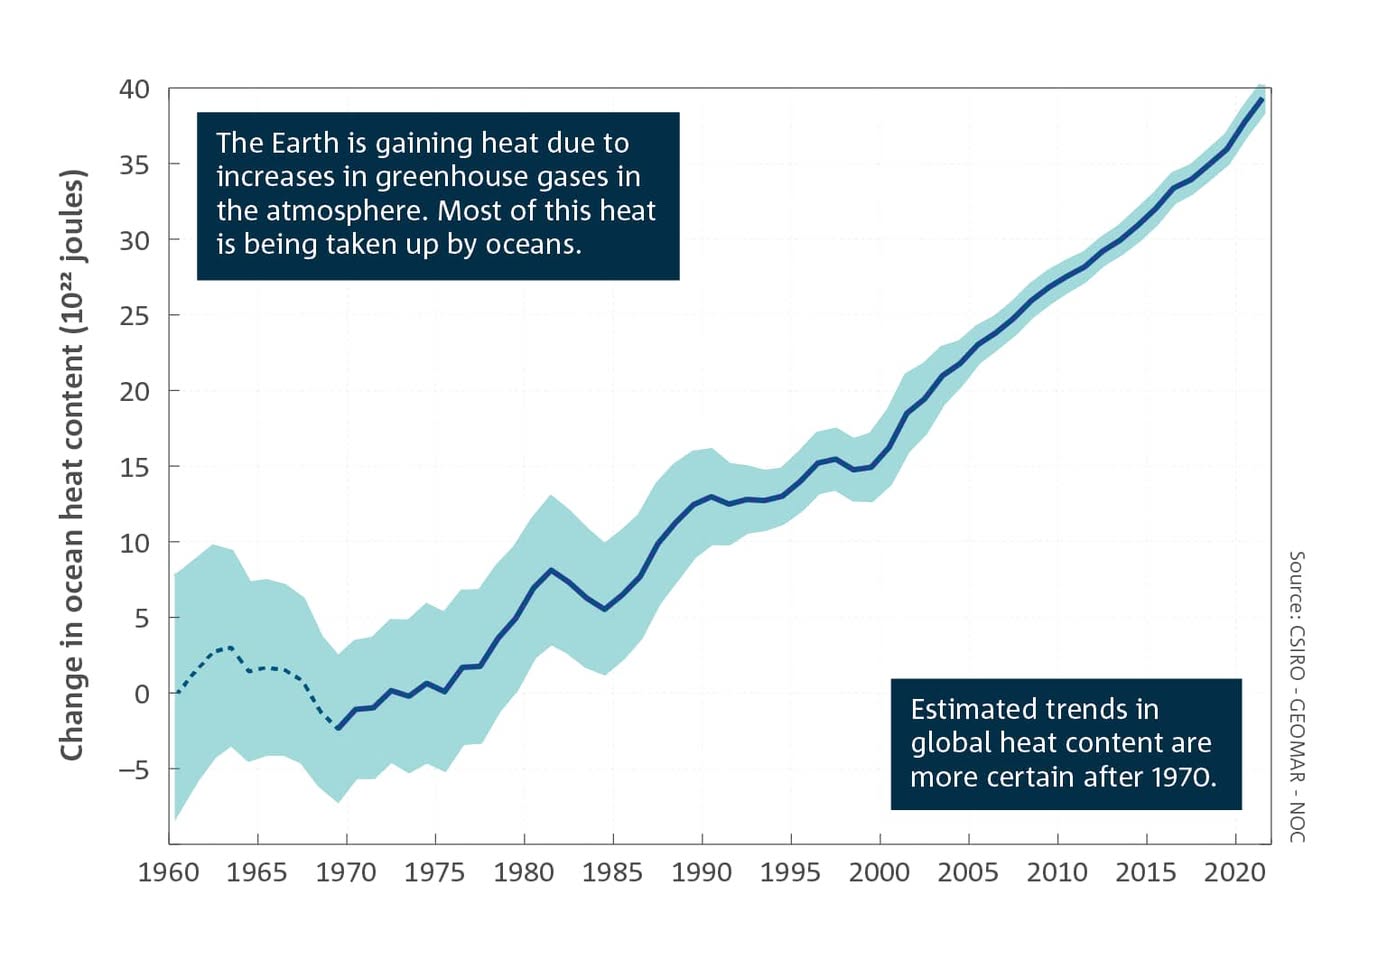
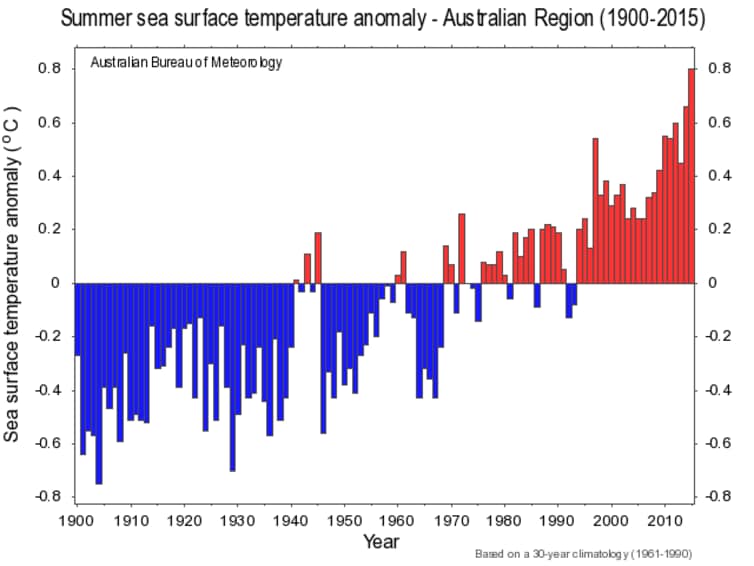
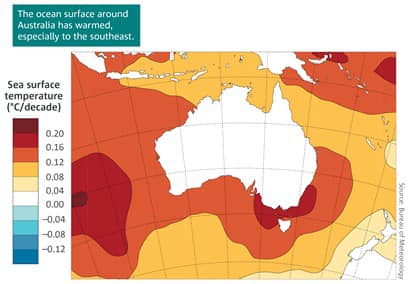
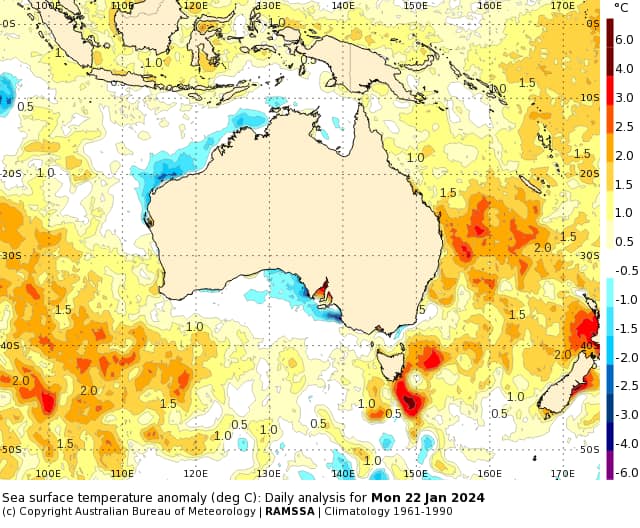
A climate denier trick is to claim that every change to climate we experience is just normal variation. Luckily we have data to show this isn’t true. Take sea temperatures, a hugely important measure, because the oceans have absorbed most of the heat from climate change to date. The first graph shows the enormous amount of extra heat going into the oceans in the past half-century. The other three graphs show the impact on oceans around Australia. The last graph is this week, showing the anomalies in this temperature i.e. how much they’re NOT normal. It’s a direct measure they calculate. The map of Australia with the tinges of blue off the north-west and south. Look at the ocean off the east coast, showing sea temperatures there are way beyond the normal averages. And this is during an El Niño event, where ocean temperatures are usually cooler. These are LONG-TERM data series. If these changes were normal, this data would show no change. We’re cooking. 720 million tonnes of Greenland’s ice sheet are melting every DAY.